
With the growing demand to accelerate data transformations between multiple systems improving the performance of Azure Data Factory (ADF) data flows and pipelines is key to getting the most efficiency out of the product. This involves optimizing various aspects of the data integration processes. Here are our top 10 common issues, along with resolutions to help you increase integration speed:
Issue 1: Cluster re-use/TTL (time to live) is not enabled
Possible Solution/Resolution:
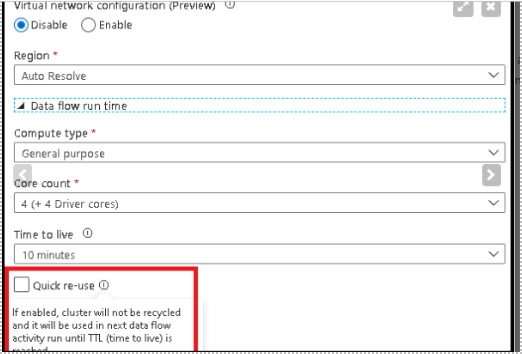
Enable Cluster re-use/TTL (time to live) on the Integration Runtime which enables Pipelines and Data flows that run in sequential order to start up much faster.
Expected Outcome:
Quick re-use feature is available only on a new IR (Integration Runtime) which has a region selected. So, you would need to create a custom IR that is not the out of the box Auto-Resolve IR. Auto-Resolve IR always spins up a job cluster each time which can take around 5 minutes.
Data flow execution time and start up time are two separate durations. So, if you have two data flows that run in sequential order. You may have up to 10 minutes of just cluster start up time since each data flow startup takes 4-5 minutes to complete. But by selecting the re-use option with a TTL setting, you can direct ADF to maintain the Spark cluster for that period of time after your last data flow executes in a pipeline. This will provide much faster sequential executions using that same Azure IR in your data flow activities.
Specifying a time to live value keeps a cluster alive for a certain period of time after its execution completes. If a new job starts using the IR during the TTL time, it will reuse the existing cluster and start up time will be greatly reduced. After the second job is complete, the cluster will again stay alive for the TTL time.
Issue 2: Integration Runtime Core Counts are Low
Possible Solution/Resolution:
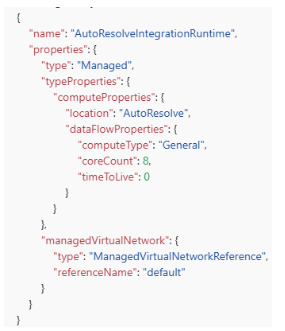
Within the Integration Runtime, increase the core count which will help speed up the execution times.
Expected Outcome:
A Spark cluster with more cores increases the number of nodes in the compute environment. More nodes increase the processing power of the data flow. Increasing the size of the cluster is often an easy way to reduce the processing time.
The default cluster size is four driver nodes and four worker nodes (small). As you process more data, larger clusters are recommended. Below are the possible sizing options:
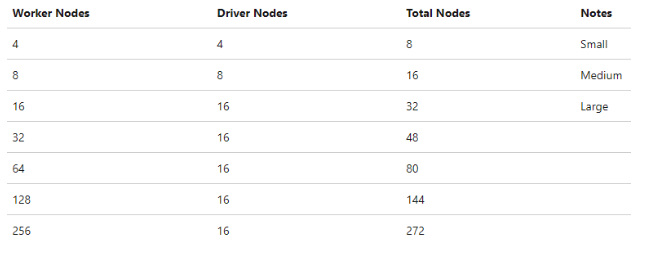
Current Default settings in IR are eight total nodes. Microsoft recommends eighty for optimal performance
Issue 3: Run in Parallel is Disabled within Sink Step Properties
Possible Solution/Resolution:
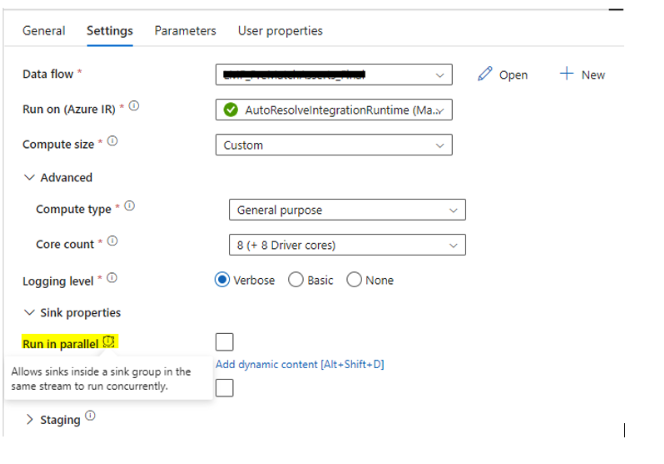
Within the Data Flow settings, if there are branches within the data flow that results in multiple sink steps, then run the sinks in Parallel.
Expected Outcome:
The default behavior of data flow sinks is to execute each sink sequentially, in a serial manner, and to fail the data flow when an error is encountered in the sink. Additionally, all sinks are defaulted to the same group unless you go into the data flow properties and set different priorities for the sinks.
Data flows allow you to group sinks together into groups from the data flow properties tab in the UI designer. You can set both the order of execution of your sinks, and group sinks together using the same group number. To help manage groups, you can ask the service to run sinks in the same group, to run in parallel.
On the pipeline, execute data flow activity under the “Sink Properties” section is an option to turn on parallel sink loading. When you enable “run in parallel”, you are instructing data flows write to connected sinks at the same time rather than in a sequential manner. In order to utilize the parallel option, the sinks must be grouped together and connected to the same stream via a New Branch or Conditional Split.
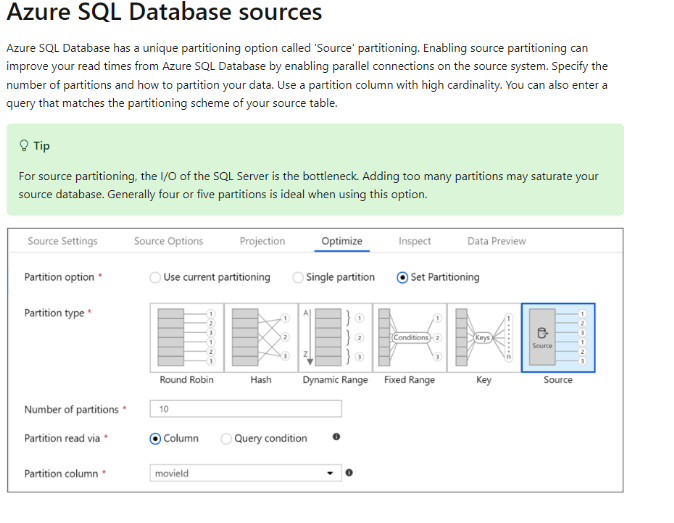
Issue 4: Default Partitioning is Selected when Azure SQL DBs is the Source
Possible Solution/Resolution:
Change the Optimization settings on the Azure SQL source to ‘Source’ Partitioning.
Expected Outcome:
Issue 5: Custom Integration Runtime with Shuffle Partitioning has not been Setup
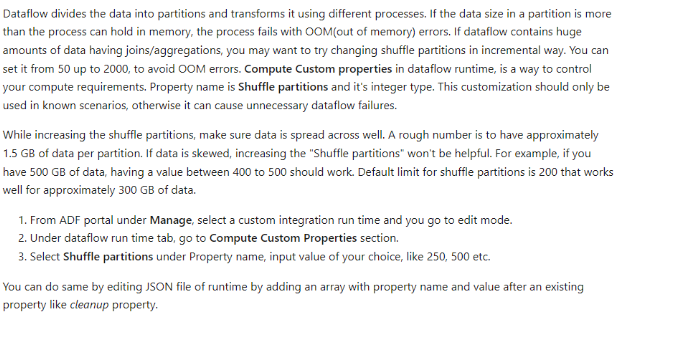
Possible Solution/Resolution:
Custom Shuffle Partitioning. This requires a custom integration runtime and not the out of the box IR that is setup.
Expected Outcome:
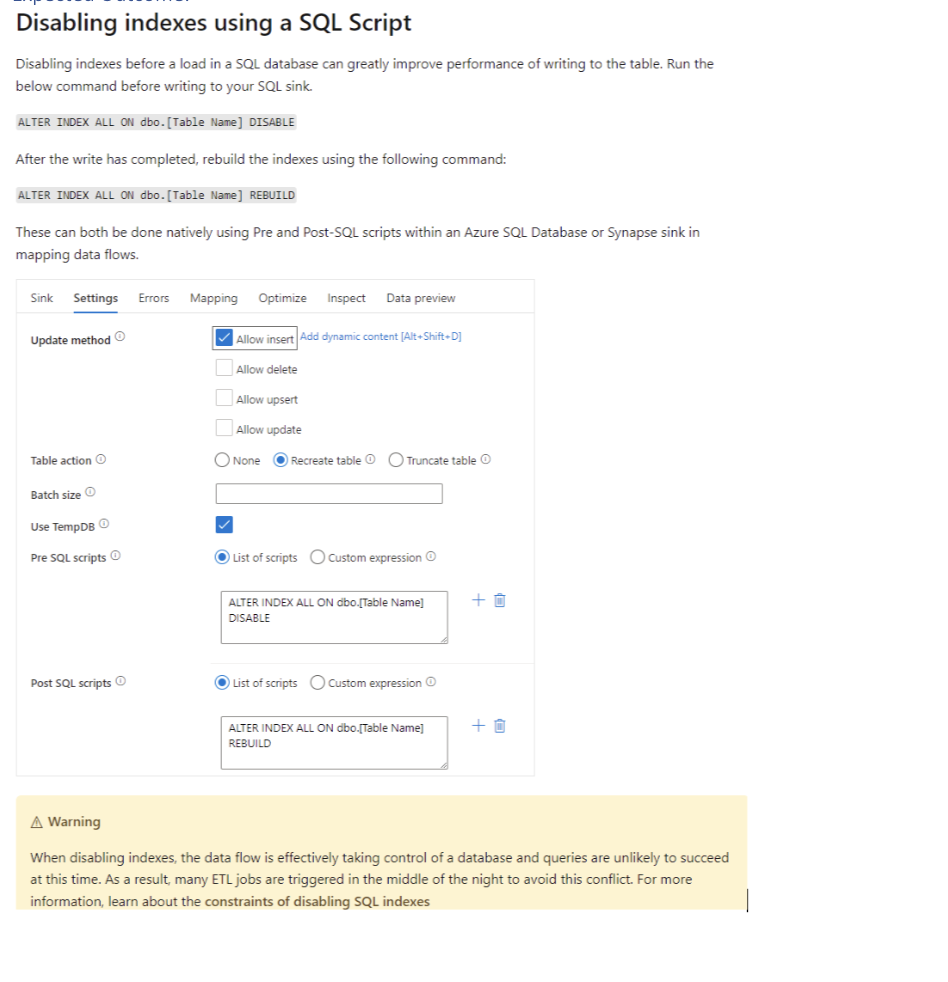
Issue 6: Indexes are Enabled within Sink Step Settings
Possible Solution/Resolution:
Disable indexes before a load into the Azure SQL database using SQL Script.
Expected Outcome:
Issue 7: Azure SQL Database Used as Source & Sink are not Scaled to Microsoft Recommendations
Possible Solution/Resolution:
Scaling up the Azure SQL database.
Expected Outcome:
Schedule a resizing of your source and sink Azure SQL DB and Data warehouse before your pipeline runs to increase the throughput and minimize Azure throttling once you reach DTU limits. After your pipeline execution is complete, resize your databases back to their normal run rate.
Issue 8: Unclear Pipeline & Data flow Structures
Possible Solution/Resolution:
Breaking out a complex process into multiple flows and keeping a clear pipeline structure is an ultimate must. A well-organized pipeline/data flow layout can provide significant improvements in how smoothly the integrations run.
Expected Outcome:
If you put all of your logic inside of a single data flow, the service executes the entire job on a single Spark instance. While this might seem like a way to reduce costs, it mixes together different logical flows and can be difficult to monitor and debug. If one component fails, all other parts of the job fail as well. Organizing data flows by independent flows of business logic is recommended. If your data flow becomes too large, splitting it into separate components makes monitoring and debugging easier. While there is no hard limit on the number of transformations in a data flow, having too many makes the job complex.
Issue 9: Joins, Exists, and Lookup Steps are not Fully Optimized with Correct Broadcasting Option
Possible Solution/Resolution:
Select the best broadcasting option based on the join or aggregate scenarios.
Expected Outcome:
In joins, lookups, and exists transformations, if one or both data streams are small enough to fit into worker node memory, you can optimize performance by enabling Broadcasting. Broadcasting is when you send small data frames to all nodes in the cluster. This allows for the Spark engine to perform a join without reshuffling the data in the large stream. By default, the Spark engine automatically decides whether to broadcast one side of a join. If you are familiar with your incoming data and know that one stream is smaller than the other, you can select Fixed broadcasting. Fixed broadcasting forces Spark to broadcast the selected stream.
If the size of the broadcasted data is too large for the Spark node, you might get an out of memory error. To avoid out of memory errors, use memory optimized clusters. If you experience broadcast timeouts during data flow executions, you can switch off the broadcast optimization. However, this results in slower performing data flows.
When working with data sources that can take longer to query, like large database queries, it is recommended to turn broadcast off for joins. Sources with long query times can cause Spark timeouts when the cluster attempts to broadcast to compute nodes. Another excellent choice for turning off broadcast is when you have a stream in your data flow that is aggregating values for use in a lookup transformation later. This pattern can confuse the Spark optimizer and cause timeouts.
Issue 10: Efficiency in Debugging can be Difficult to Find Underlying Bottlenecks
Possible Solution/Resolution:
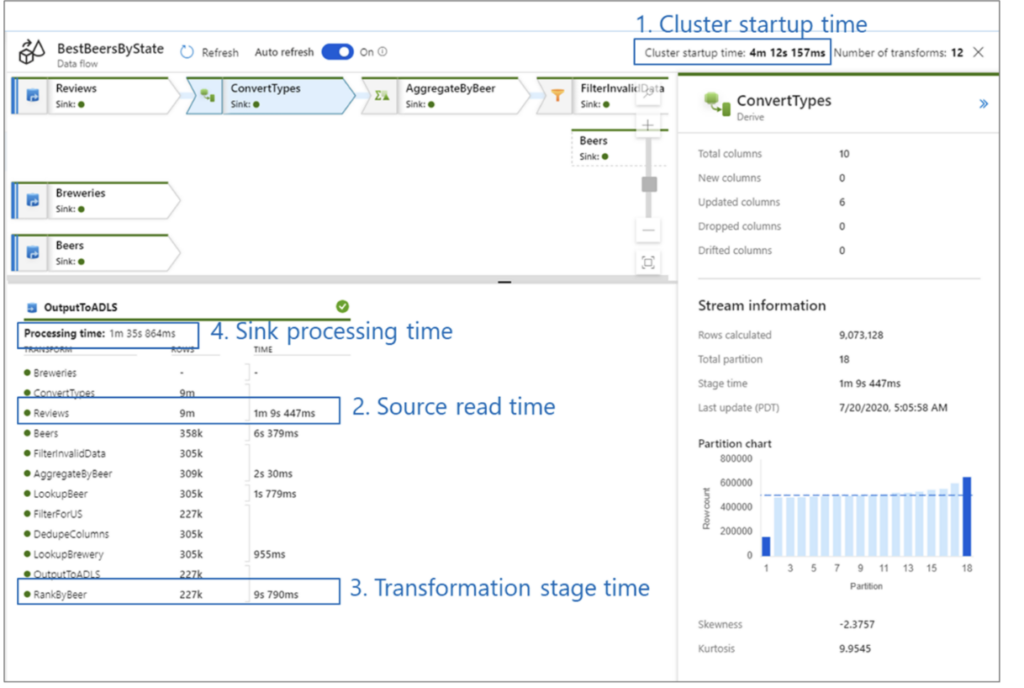
Check the four main possible bottlenecks to look out for within the detailed monitoring information
- Cluster start-up time
- Reading from a source
- Transformation time
- Writing to a sink
Expected Outcome:
Cluster start-up time is the time it takes to spin up an Apache Spark cluster. This value is in the top-right corner of the monitoring screen. Data flows run on a just-in-time model where each job uses an isolated cluster. This startup time generally takes 3-5 minutes. For sequential jobs, startup time can be reduced by enabling a time to live value. For more information, see the Time to live section in Integration Runtime performance.
Data flows utilize a Spark optimizer that reorders and runs your business logic in ‘stages’ to perform as quickly as possible. For each sink that your data flow writes to, the monitoring output lists the duration of each transformation stage, along with the time it takes to write data into the sink. The time that is the largest is likely the bottleneck of your data flow. If the transformation stage that takes the largest contains a source, then you might want to look at further optimizing your read time. If a transformation is taking a long time, then you might need to repartition or increase the size of your integration runtime. If the sink processing time is large, you might need to scale up your database or verify you are not outputting to a single file.
Once you have identified the bottleneck of your data flow, use the below optimizations strategies to improve performance.
Applying all or some of these solutions should help increase the efficiency and speed of your company’s data transformations. Remember to assess specific requirements and characteristics of your data integration scenarios to apply the most relevant optimizations. Testing different configurations will help you determine the most effective strategies for improving performance in your Azure Data Factory pipelines and data flows.
Join the Community
If you found this blog helpful, subscribe below to receive our monthly updates.


