Boosting Throughput with Better Business Intelligence
Wenger Manufacturing was using an assortment of non-searchable Word documents for production planning and tracking that made it difficult to measure project volume, velocity and value. A new Power BI dashboard populated with contracting, finance and engineering data has improved visibility and brought new urgency and accuracy to all departments of the 80-year-old manufacturer of commercial extrusion systems.
Every day, millions of dollars are stored on the factory floor, right out in the open, at Wenger Manufacturing.
No, these millions aren’t pallets of cash. But they are pallets of materials, motors, and highly-engineered components that are assembled to create the custom-designed commercial extrusion systems that Wenger ships to customers all over the world.
As director of planning and analysis at Wenger, Dan Gaston and his team are responsible for the data and reporting required to make sure plans and projects make their way through the Wenger facilities as quickly as possible so they can be turned into the vital cash required for research, development – and payroll.
“We embarked on a company-wide initiative a year ago to thoroughly document our processes and pain points and we were having a tough time pulling together meaningful metrics we could use to benchmark our performance,” says Gaston. “That’s when we realized we needed outside help to catalog our data sources and get our arms around it.”
Gaston and Wenger leadership selected New Dynamic to assess needs, define requirements and develop a plan to extract and organize relevant data points. Gaston and New Dynamic partner Jeff Ney had worked on other projects together, so Gaston knew what to expect when he called New Dynamic.
“Jeff and the New Dynamic team have great business acumen,” says Gaston. “In this case, they were willing to be flexible on discovery and scoping. I knew they could dive in and be productive immediately.”
Pains & Gains
Pains
- Contracting, finance, and production information was previously stored in a collection of disconnected, unsearchable Word and Excel documents.
- Attaining production data on costs, stages and deliverables was labor intensive.
- The lack of visibility created bottlenecks and hurt cash flow.
Gains
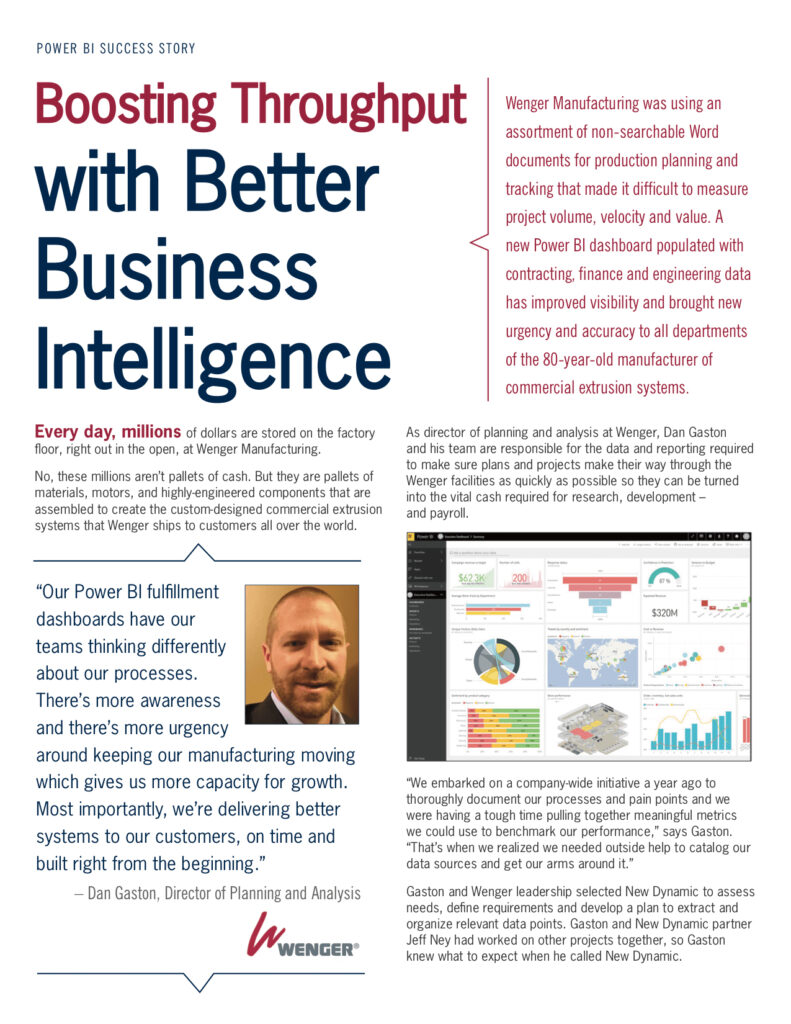
- Wenger’s new Power BI dashboards focused on fulfillment put sales, finance, and production performance information in one place and easy for all to see.
- With new visibility into throughput, Wenger expects to save weeks on new system manufacturing.
- Wenger can work through its backlog more quickly to accelerate cash flow and add capacity, and customers get their orders faster and free of defects.
Power BI Dashboards Highlight What Can Be Measured – and Managed
The New Dynamic team first mined everything data-wise that could be gleaned from Wenger accounting and ERP systems.
Then, a set of key performance indicators were developed to focus on a single theme: fulfillment.
Wenger leaders determined that if an emphasis on customer delivery could be monitored and managed more precisely, everything else would follow.
Four attributes were selected to measure overall fulfillment performance:
- Velocity – speed from quote to cash;
- On-time delivery – milestones and target
date compliance; - Accuracy – error and omission rates; and
- Success – customer experience survey scores.
The platform selected to display these new KPI’s was Power BI, Microsoft’s cloud-based business analytics service that brings disparate business data points into one view.
“Our sales, finance, and manufacturing teams can now tell whether we’re ahead of plan or behind,” says Gaston. “Entering and re-entering data into different documents for reporting purposes is no longer necessary, and we’re not wasting time trying to manage multiple versions of the same document. There is one version of the truth.”
Gaston said that even though the KPI dashboards have been available for only a few months, they’re already generating surprises – and results.
“Getting an accurate read on the length of time we spend on some steps has been a real eye-opener for all of us,” says Gaston. “We were clearly underestimating cycle times and the ripple effects of those extra days and weeks. The Power BI dashboards have helped us quantify wasted time and delay in terms of revenue and cash flow.”
The new Power BI dashboards are reviewed and discussed at various management meetings throughout the company every month. And Gaston says that the new insights and process improvements are changing goals and behaviors.
The main goal is to shave precious days and weeks off Wenger manufacturing times. Now it can be measured and monitored from start to finish.
“Our Power BI fulfillment dashboards have our teams thinking differently about our processes. There’s more awareness and there’s more urgency around keeping our manufacturing moving which gives us more capacity for growth,” says Gaston. “Most importantly, we’re delivering better systems to our customers, on time and built right from the beginning.”


